Viewing data
Resgen uses the HiGlass viewer to show large genomic datasets. This page will outline how to load a dataset in the HiGlass viewer.
Tagging data
To view a dataset, it has to have appropriate filetype and datatype tags. In the previous section we added a dataset that was automatically tagged with the filetype:cooler and datatype:matrix tags. Other supported tags are:
The list here is not exhaustive. For a more complete list of available track types, please consult the HiGlass documentation on the topic.
Viewing data
To view a dataset, drag the eye icon next to its name onto the viewer.
The datatype will determine where in the viewer the data can be viewed. Dropping the icon onto one of the highlighted regions will place the data in that location on the viewer.
Overlaying on an existing track
To add a dataset on top of an already existing track, use the dataset's menu, click on "Add to existing track" and then select the track to add it to.
Configuring tracks
Tracks, once added to HiGlass can be configured by using their config menu. Each track type has its own list of available options which are partially enumerated in the HiGlass documentation. Note that in order for the config menu to appear, the mouse has to be above the track.
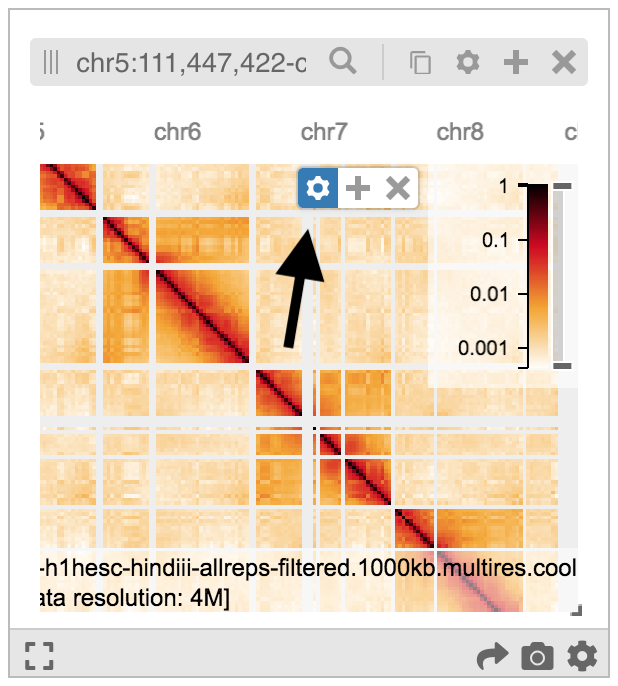
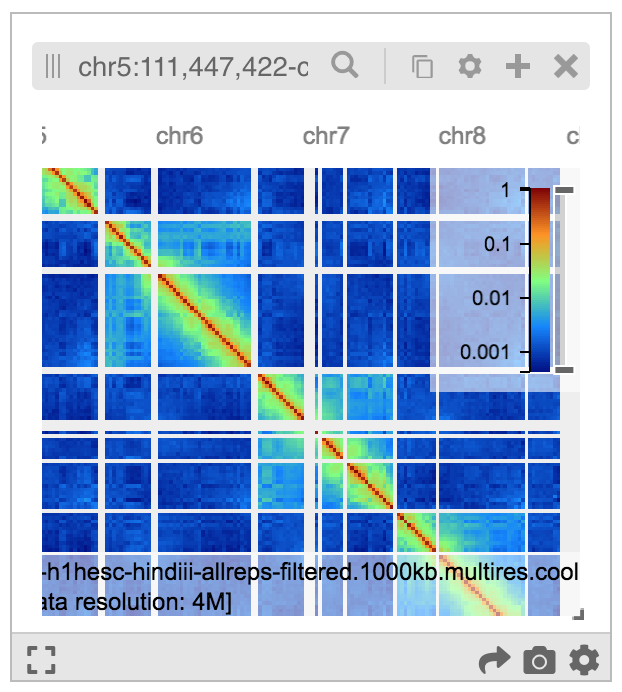
The example below shows a Hi-C heatmap with a color map chosen by following the Config Menu -> dixon2012... -> Configure Series -> Color map -> Jet sequence of menus.
Navigating to a genomic location
To go to a region in the heatmap, the viewer needs to have a chromsizes track. Adding one can be done in two ways:
1. Add a chromsizes-tsv file and tag it.

2. Find a chromsizes dataset in the public data by clicking on the search bar and searching for the assembly tag:
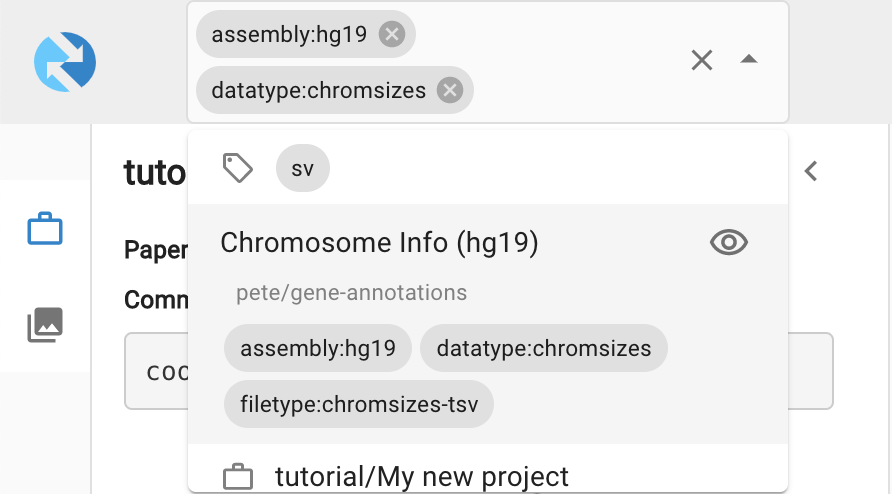
When you've found an appropriate chromsizes dataset, add it to the viewer to enable searching by chromosome location. Important: Make sure that the chromosome order in the chromsizes file matches that of your datafile.
Now that we've created a view, the next section will describe how to save it for future reference or share it with others.
Scrolling vertically
If your data trails off the bottom of the HiGlass window, you can scroll by holding down the meta (command key on a mac) key to scroll vertically rather than zooming:
Note that vertical scrolling is poorly supported for views that have a 2D matrix. The 2D matrix is meant to be resized to fit into the space remaining after 1D tracks are accounted for. If the 1D tracks extend beyond the visible viewport, the size of the 2D map becomes undefined.
Viewport projection
An easy way to create a viewport projection is to hold down the 'a' key while dragging over a region to select it and then clicking on 'Open selected region in new view'. This will create the viewport projection and label it with the label of the newly created view.
